Quantcast
Channel: Developer Express Global
Viewing all 3388 articles
Browse latest View live

Blog Post: Reporting: New Binding Expressions (v.17.2)

$
0
0

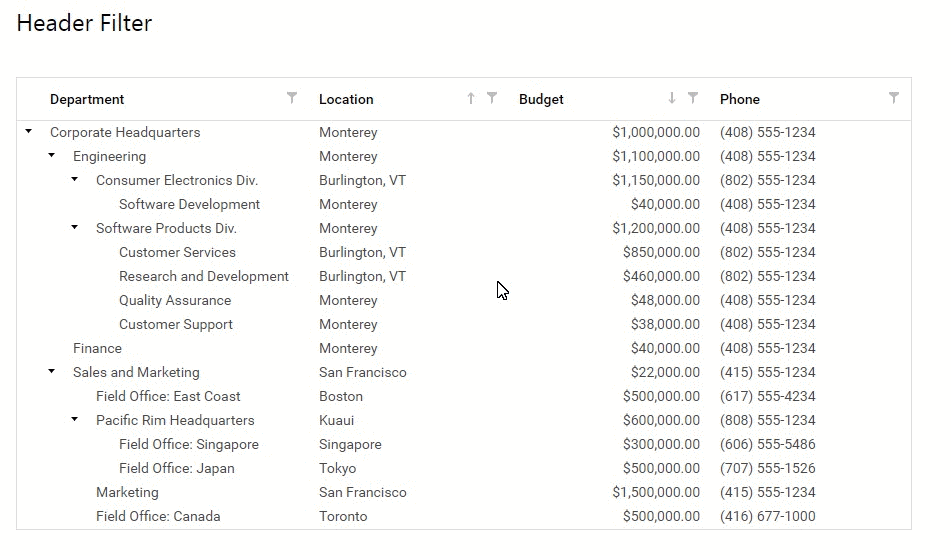
In the v17.2 release, DevExpress Reporting has taken a big step to simplify the report creation process for end-users and introduced a new way for providing data to report controls and shaping data. Instead of using data bindings as in earlier versions, reports now use binding expressions by default.

Previously, end-users need to handle script events to implement any custom logic in reports, which has certain security implications and requires familiarity with programming languages. Newly introduced binding expressions cover most scenarios of using scripts and make it much simpler to evaluate summary results and conditionally format report data. You can now assign values to not only a limited number of bindable properties, but virtually to any other property of a target report control. 


It’s considerably easier for end-users to internalize expressions’ criteria syntax instead of writing code in script event handlers. 


With expressions mode enabled, the Properties grid contains the special Expressions tab providing properties for which you can specify custom expressions. Clicking the property’s ellipsis button invokes the Expression Editor, which has been improved to provide access to report bands and controls as well as to special property values.


A new approach brings almost no changes to traditional ways of binding report controls to data. As before, you can drag and drop the required item form the Field List, or click the control’s smart tag and select the data field from the drop-down list.
  

Starting with v17.2, you can invoke the Expression Editor and specify a complex binding expression involving two or more data fields (as you did for calculated fields in earlier versions).
  

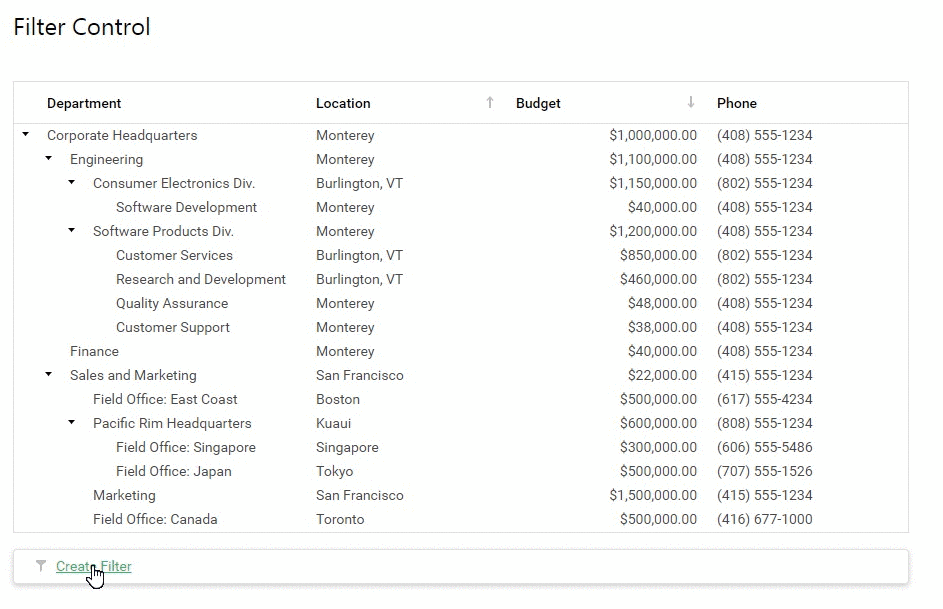
Expressions also enable end-users to evaluate custom summary results without handling script events. Select the range for which to calculate the summary and click the Expression’s property ellipsis button. In the invoked Summary Expression Editor, a new Summary category appears where you can find summary functions whose names start with the "sum" prefix that is added to make it easy to differentiate aggregate functions from report summary ones.


With binding expressions, you are no longer required to create formatting rules and assign them to controls. You can provide conditions for the control’s individual appearance settings or for the style name (in case of multiple appearance changes). 


You can specify which binding mode your reports use by setting the static UserDesignerOptions.DataBindingMode property. This property is available in the Report Designer Options dialog in Visual Studio at design time.
  

Currently, the following binding modes are available:
- Standard Data Bindings – the legacy binding mode available in all previous versions.
- Expressions (simplified) - the default mode used in newer report versions. With this mode, you can solve tasks that previously required you to handle the BeforePrint script event.
- Expressions (advanced) – this mode enables you to provide expressions in both the BeforePrint and PrintOnPage events.

To help you migrate your existing reports to use the new binding mechanism, we’ve provided an automatic report conversion tool. When the static UserDesignerOptions.ConvertBindingsToExpressions option is enabled for your end-user reporting application, when opening a legacy report, an end-user is prompted to convert this report to use a new binding mode. The Report Designer Options dialog in Visual Studio contains this option as well.
  

Consider the following cases in which a report cannot be converted:
- A report contains one or more controls bound to a data source, which is not assigned as the report’s data source.
- A report contain a formatting rule, whose data source differs from the report’s data source.
 
Note that backward conversion of reports (from using expressions back to legacy bindings) is not available.

As always, we would love to hear your thoughts on this new feature.


Blog Post: HTML5 JavaScript Scheduler Improvements (v17.2)

$
0
0

Check out the new features of the DevExtreme HTML5 Scheduler widget that are coming in the v17.2 release. These features improve the Scheduler appearance and also help you to customize both appointments and views.

Display Several Days, Weeks and Months

Different tasks may require different planning periods. For example, training sessions require semesters, agile software development - iterations, etc. With the upcoming release, we've added a capability to display a custom period on a view by specifying an intervalCount option.

This option is available as a part of the view config. For example, here we set the interval for two work weeks:

$("#scheduler").dxScheduler({
    // …
    views: [
    {
        name: "2 Work Weeks",
        type: "workWeek",
        intervalCount: 2
    }]
});

Indicate the current time

Another feature in v17.2 for the Scheduler widget helps you to distinguish between past and future appointments, as well as tasks. The Scheduler will now provide a specific indicator that highlights the current day and time on views with the time scale. Note that the indicator changes its position with the interval that's specified in the indicatorUpdateInterval option.

The indicator is visible by default. You can hide it by setting the showCurrentTimeIndicator option to false.

Additionally, you can apply shading to cover the timetable up to the current time by assigning true to the shadeUntilCurrentTime option.

Limit number of full-sized appointments per cell

Previously, the Scheduler could show only two full-sized appointments in a cell, while collapsing others. This approach was not flexible and also didn't allow for showing more appointments on wider screen displays.

With v17.2, you can change the number of full-sized appointments per cell using the new maxAppointmentsPerCell option. This allows you to specify a strict limit on displayed appointments, calculate it automatically, or even remove the limitation. On exceeding the limit, appointments no longer become collapsed; instead, they are removed to an appointment collector, from which you can easily drag appointments back to the timetable.

Now, appointments in the appointment collector's drop-down list do not have an Edit button because a click on an appointment opens the edit form. Use the dropDownAppointmentTemplate option to customize these appointments.

Cell Size Customization

With v17.2, you can easily customize cell sizes keeping all elements aligned. Simply specify the desired cell width and height using the dx-scheduler-cell-sizes-horizontal and dx-scheduler-cell-sizes-vertical CSS classes.

Angular, ASP.NET MVC/Core, & More!

Note that all these new features are available on all the frameworks we support: Angular, jQuery, Knockout, ASP.NET MVC, and .NET Core.

Try it now

The new features of our dxScheduler widget are included in the v17.2 pre-release that is available via npm right now. Please note that this pre-release may contain some bugs and is not intended to be used in production:

npm install devextreme@17.2.2-pre-beta

Learn more about DevExtreme's pre-releases in this blog post.


What do you think about the DevExtreme Scheduler's improvements in the next release? Drop me a line below.

Email: mharry@devexpress.com

Twitter: @mehulharry

Blog Post: Unified criteria-based filtering in WinForms grids (coming soon in v17.2)

$
0
0

In the v17.2 release of DevExpress WinForms, we’re adding a valuable new feature across our full range of grid-based controls (Data Grid, Property Grid, Pivot Grid and Vertical Grid): a criteria-based filtering system. This filtering system is common across all the grid controls (hence, unified) and uses a criteria-based language to define filters.

// Set active filter for Chart
chartControl.SeriesTemplate.FilterString ="[Year]>=2015 And [Company]='DevAV Center' And [Sales]>50000";

The legacy methods in these controls to filter data still work (and you can still use them), but we recommend switching to this new criteria-based filtering. After all, doing so will help your users immeasurably: they only have to learn one way of filtering.

The filtering engine itself receives a few moderate enhancements:

  • a new “Blanks” item in filtering pop-ups;
  • HTML-formatting for filter and data items;
  • new PrepareTemplate, CustomizeTemplate and QueryFilterCriteria events that provide the ability to modify filtering UI templates and criteria expressions.

With v17.2, you can expect one filtering UI enhancement implemented in, say, the Data Grid to be automatically expanded to the rest of the supported data-aware controls, since all of them now share a unified filter editor set.

As an example, the image below illustrates the HTML-formatting applied to a Data Grid pop-up and an editor set generated by the Filtering UI Context component.


Speaking of the Filtering UI Context component, it has been refined as well. The most important enhancement is that it no longer requires you to build a filtering Model anymore. Instead, you associate a target control (e.g., a Grid View) with the component with a couple of clicks at design time and thereby instantly generate all the filtering UI editors required.

Other improvements include:

  • An ability to change editor types and settings directly at design-time
     

  • Automatic two-way binding: any filtering operation a user performs in the generated UI reflects within the data-aware control’s UI, and vice versa.

  • New filtering editor templates.

Blog Post: DevExtreme: New TypeScript declarations and improved Angular typings (v17.2)

$
0
0

One of the things we support from the very first release of DevExtreme is TypeScript.

new-TypeScript-declarations-typings-for-angular-blog

As many of you know, TypeScript and its tooling allow us to use compile-time type checks and it offers support for classes and interfaces. Because of these features, one is able to build large scale JavaScript applications. In fact Google is using TypeScript for developing Angular.

With our v17.2 release we have improved our TypeScript declarations for the DevExtreme widgets API as well as the Angular integration layer.

What does this mean?

In the previous releases, most of the classes in the DevExtreme API had weakly typed properties (of type ‘any’). This means that compile time type checking always resulted in a successful build even if you try to bind a string value to a property which needs a number.

With v17.2 we have made the DevExtreme API strongly typed which results in improved code editor hints:

wrongtype

One of the cool features of TypeScript is the use of union types (‘|’ sign). This allows us to specify a number of types to be used like shown in the following table:

 v17.1v17.2
dxDateBoxOptionsvalue? : anyvalue? : Date | number | string
All widgetsdataSource? : anydataSource? : Array | DataSource | DataSourceOptions | string;

To make the DevExtreme API more fluent, we’ve also introduced the use of ‘type’ declarations like:

     export type format = string | ((value: number | Date) => string) | {
        type?: string,
        precision?: number,
        currency?: string,
        formatter?: ((value: number | Date) => string),
        parser?: ((value: string) => number | Date)
     };
     //...
     // in dxDateBoxOptions
     displayFormat?: format;

While we were working on these developer improvements, we worked on the IntelliSense support as well. All the information you normally look up on our documentation site will now show up in the Quick Info tooltip and it is used in the code-completion to increase your productivity.

uniontype

What about Angular?

Because Angular is written in TypeScript, all these developer sweetness works for Angular as well!

We have strongly typed the Angular Component properties which results in less runtime errors because the build process of an Angular application will do the type-checking for us.

data-image-png;base…

And while coding, we are now able to give you short descriptions through the Quick Info panel in IntelliSense as well.

desc_light

Try it now?

So ready for a test-drive?

These new features are included in the v17.2 pre-beta that is available through npm right now. Please note that this pre-beta may contain some bugs and is not intended to be used in production: 

npm install devextreme@17.2.1-pre-beta

Learn more about DevExtreme's pre-releases in this blog post.

Like it?

Let me know by replying to this post if you like the features outlined in this post.

Blog Post: Germany Meetups: November 29th Frankfurt, November 30th Munich

$
0
0

After our initial kick-off meetup in Utrecht, The Netherlands on November 27th, John and I will be in Frankfurt at the 29th of November.

Frankfurt Meetup

We will be hosting our second meetup in the Ambassador Club on the 7th floor of Fleming’s Selection Hotel at the Eschenheimer Tor 2 in Frankfurt-City.

You will be informed on the latest features of our v17.2 release, and you’ll be able to discuss them with me or other DevExpress customers. The drinks and snacks are on us and we’re looking forward meeting you.

If you want to join this meetup, make sure to register you seat by clicking here.

image
image

Munich Meetup

On November 30, John and I will be in Munich for our 3rd Meetup. We’ll host this one in the Augustiner Keller und Biergarten, and while we go over the awesome new features of v17.2, you’ll be paying attention while having a beer and some snacks.

I’d love to talk with all of you and hear your comments and feedback, and maybe even some suggestions for our next major release.

If you want to join this meetup, make sure to register you seat by clicking here.

If you can't make it to any of these locations, let me know so we can investigate possible other locations for additional meetups.

I hope to see you in Frankfurt or Munich!

Blog Post: ASP.NET TreeList Enhancements (Coming soon in v17.2)

$
0
0

Check out these great enhancements the DevExpress ASP.NET TreeList is getting in the next major release, v17.2.

The DevExpress ASP.NET TreeList and GridView controls are similar in features and API. One of the major features missing in the DevExpress ASP.NET Treelist control was the ability to filter data. So in 2017, we worked hard and think you'll be happy with the results.

Filtering

Starting with the v17.2 release, we are providing filtering support for the DevExpress ASP.NET TreeList control. You'll be able to filter your data in the same manner as you do in the GridView control. Let's dive in and see all the different ways:

1. Search Panel

The DevExpress ASP.NET TreeList allows you to filter data and highlight search results via its integrated Search Panel. It's an easy way to find the data by typing the filter criteria in the search panel editor.

Simply enter the text in the Search Editor and the TreeList will display the records matching your criteria:

2. Data Filter Row

The filter row allows users to filter data by entering text in the editors displayed below individual column headers. Each editor builds a FilterExpression for the corresponding column using typed text and chosen filter operator in FilterRow menu.

You can see it in action here:

3. Header Filter

Another enhancement is HeaderFilter mechanism that displays a dropdown with a list of unique values of the specified column. By selecting one or more values, you'll be able to quickly filter for the matching criteria:

4. Built-in FilterBuilder

We've also integrated the excellent FilterBuilder into the TreeList.

The FilterBuilder is a powerful tool that provides the most flexible approach for filtering data. With FilterBuilder you'll be able to build filter criteria of any complexity with unlimited number of conditions and logical operators.

Unbound Columns

We're also introducing support for Unbound Columns, which allow you to add columns to to the TreeList without needing a data source.

Unbound columns can be populated manually by handling corresponding events or by specifying an UnboundExpression that is used to evaluate the values. You can sort, group, and filter unbound columns in the same way as data-bound columns.

ASP.NET MVC supported

All of these features are also available for the DevExpress ASP.NET MVC TreeList control too.

Try it today

You can test these new features today by downloading the DXperience v17.2 Beta that is available in your download center (for existing customers).

Thanks!

Email: mharry@devexpress.com

Twitter: @mehulharry

Blog Post: Pyramid Charts with the DevExtreme HTML5 Funnel Chart Widget (v17.2)

$
0
0

This post covers the DevExtreme Funnel Chart widget, which is available for jQuery, as an Angular component, ASP.NET MVC and ASP.NET Core MVC controls, and as a Knockout binding.

The Funnel Chart widget can be used to display pyramid charts as well as funnel charts (which have previously been described in this blog post). A pyramid chart is an isosceles triangle (meaning it has two sides of equal length) divided into sections. These sections are ordered by importance, which allows pyramid charts to be used to visualize hierarchies. The height of each section indicates quantity.

How to use a Pyramid Chart

Perhaps the most common example of a pyramid chart is Maslow’s hierarchy of needs. This pyramid arranges human needs from the most fundamental, such as food, water and rest, at the base to comparatively less essential, like fullfilling one’s potential, at the top. We created this chart using the new DevExtreme Funnel Chart widget available in the upcoming v17.2 release.

Maslow's hierarchy of needs

A pyramid chart has many applications besides Maslow’s hierarchy. Visualizing the organizational structure of a company is one of them. Executives appear at the top of the pyramid, above middle management, and lower-ranking employees are shown at the bottom. The chart reflects both the power structure in the company and the relative size of each group.

Organization structure

In the following example, a pyramid chart is used to analyze sales in a bike shop. In this case, the hierarchy indicates a priority of the goods sold by the shop, perhaps an advertising priority or a shipping priority. From this chart, you can see that clothing sells almost as well as bikes, which are presumably the “main” article, since they are shown at the pyramid base. Increasing the supply of clothing might add to the revenue.

Sales

Try it

A beta of v17.2 is available right now via npm:

npm i devextreme@17.2.2-pre-beta

Use the following code to create a simple pyramid chart:

$("#pyramid").dxFunnel({
  dataSource: [
    { item: "Lower-ranking Employees", count: 200 },
    { item: "Middle Management", count: 150 },
    { item: "Executives", count: 30 }
  ],
  title: "Organization Structure",
  sortData: false,
  argumentField: "item",
  valueField: "count",
  algorithm: "dynamicHeight",
  inverted: true
});

Please let us know your thoughts about this use case!

Blog Post: ASP.NET Spreadsheet Enhancements - Adaptive Dialogs and more (Coming soon in v17.2)

$
0
0

Check out these enhancements to the DevExpress ASP.NET Spreadsheet control that are coming in the v17.2 release:

Adaptive Dialogs

The Spreadsheet Control's dialogs will all be adaptive. This means that the dialog's content is automatically resized according to the screen resolution. To achieve this, we used the FormLayout and Popup controls in adaptive mode. The upgrades the FormLayout and Popup controls will also be available to you in the coming release. I'll discuss these other controls in a future blog post.

Check out the Spreadsheet's adaptive dialog in action here:

Bookmark navigation

The Spreadsheet Control now gives you the ability to navigate through documents using bookmarks:

For your power Spreadsheet users, they will find this feature handy to easily move around large documents.

Full screen at startup

Now you can display the Spreadsheet Control in full-screen mode on page load simply by setting the server-side property value: FullscreenMode.

ASP.NET MVC supported

All of these features are also available for the DevExpress ASP.NET MVC Spreadsheet control too.

Try it today

You can test these new features today by downloading the DXperience v17.2 Beta that is available in your download center (for existing customers).

Thanks!

Email: mharry@devexpress.com

Twitter: @mehulharry


Blog Post: WPF Dashboard Viewer (Coming soon in v17.2)

$
0
0

We’ve got some good news for WPF developers who are active DevExpress Universal Subscribers…Our upcoming release (v17.2) will include the Community Tech Preview (CTP) of our new WPF Dashboard Viewer. Much like its WinForms counterpart, the DevExpress WPF Dashboard Viewer can be used to display a dashboard based upon an existing XML file, or a dashboard generated within Visual Studio using the DevExpress Dashboard Designer.

Beyond the obvious benefit (WPF developers need no longer rely upon a WinForms-based Viewer), our WPF Viewer gives you the ability to:

  • Load data asynchronously
    End-users can work with a dashboard while time-consuming operations are executed on the server.
  • Use WPF templates
    You can modify the look and feel of dashboard items while maintaining existing behavior.
  • Use DevExpress WPF styling/theming
    You can exercise centralized control over your app’s appearance.

WPF Dashboard Demo

If you are active Universal Subscriber and have installed our most recent beta, you can explore the capabilities of our new WPF Dashboard Viewer within Visual Studio. To create a simple Dashboard Viewer app, drop the DevExpress DashboardControl from the Toolbox into your WPF project:

WPF Dashboard on the Visual Studio Toolbox

… and provide a path to an existing dashboard XML using the DashboardSource property:

WPF Dashboard - Specify Dashboard Source in XAML

Please note - this CTP ships with the following limitations:

  • Our WPF Dashboard does not support dashboard parameters at present time.
  • Printing and Export options are not supported using the control's UI.
  • Dashboard specific APIs (such as applying master filtering, drill-down, data access, etc.) have yet to be implemented.

We welcome your comments and look forward to your feedback. If you are a WPF developer and have been waiting for a WPF-based Dashboard Viewer, please write to us at support@devexpress.com– we want to know more about your project and how we can improve the Viewer in upcoming release cycles.

Blog Post: Improvements to DevExtreme HTML5 Chart Date/Time Axis (v17.2)

$
0
0

This post covers the DevExtreme Chart widget, which is available for jQuery, as an Angular component, ASP.NET MVC and ASP.NET Core MVC controls, and as a Knockout binding.

Date/Time Series Improvements

The date/time axis has been one of the weak points of the otherwise robust DevExtreme Chart control. Some customers reported issues with the generation of tick marks at the correct intervals, or with the formatting of tick labels. It was time for us to re-evaluate and improve our implementation, and we have now completed this work for v17.2.

Tick Mark Generation

Until now, the tick mark generation mechanism for date/time-scales was inherited from the numeric scale, which turned out to be a terrible idea. Axis label intervals were calculated in milliseconds, producing ticks in awkward positions, for instance at 29 days and 12 hours instead of 1 month, or at 6 days instead of a week.

Now the tick interval is calculated so that labels always show the start of reasonable date/time intervals: the first day of a week, month or year, the start of a day, the top of an hour, etc.

Intelligent tick intervals

Axis Auto-Formatting

Before v17.2, Axis labels were generated in a straightforward manner similar to tick marks, using a single format for all of them. As a result, there were few tick labels with long text.

Now, the dxChart widget carefully chooses an axis label format for each label individually.

Date/time label formatting

Label auto-formatting is used in numeric scales, too, in which case the widget chooses one of the “large number” formats. In addition, you can set up a numeric axis to show integer values exclusively.

Numeric scale label auto-formatting

Weekend Skipping

If your dataset contains entries for workdays only, you may want to exclude weekends and holidays from the axis. This is now possible using the options holidays and workWeek (optionally) and then setting workdaysOnly to true:

$('#chart').dxChart({
  ...
  argumentAxis: {
    // specify holidays to exclude
    holidays: [
      new Date(2017, 11, 25),
      new Date(2017, 11, 26)
    ],
    // specify which days are workdays (skipping Mondays in this example):
    workWeek: [2, 3, 4, 5],
    // activate the skipping:
    workdaysOnly: true
  }
  ...
});

Weekend skipping

Try it

A beta of v17.2 is available right now via npm:

npm i devextreme@17.2.2-pre-beta

Please let us know your thoughts about these new features!

Announcement: Announcing DevExpress Universal v17.2

$
0
0
We are proud to announce the immediate availability of its newest release, DevExpress Universal v17.2. Built and optimized for desktop, web, and mobile developers alike, DevExpress Universal ships with over 500 individual products - all designed to empower today’s enterprise and help software teams deliver high performance line-of-business apps that amaze.

Blog Post: XAF - Various UX Enhancements to WinForms and Web UI (v17.2)

$
0
0

New WinForms Light Style

The new Light Style form templates (LightStyleMainRibbonForm and LightStyleMainForm) with both Ribbon and Standard menus are now available for WinForms apps. This new style layout is "cleaner," as it eliminates excessive borders. The images help demonstrate the difference between our previous (left) and new layout (right):


Use the WinApplication.UseLightStyle property to enable this feature in existing apps. All newly created apps will use this new style by default.

We are committed to improving the WinForms UI further and you will likely see more news in this regard in the future ( specifically regarding use of SVG images instead of our current images set). 


Display Reports & Dashboards in a Maximized State within a Separate Browser Tab

ASP.NET users can now open dashboards and reports within a separate web browser tab (via UI or by direct URL) using all the available space on the page (without XAF navigation elements and toolbars).

Working with dashboards and reports in a separate web browser tab is supported in the following scenarios: 

1. A user holds the Ctrl key, clicks a report or dashboard definition record in a ListView and the corresponding viewer is opened in a new tab.

2. A user opens a dashboard or report designer in a separate tab using specialized menu commands (the DashboardsAspNetModule > DesignerDisplayMode 
and ReportsAspNetModuleV2 > ShowReportDesignerActionTarget options can be set to 'NewTab').

3. A user opens the current dashboard preview in a new browser tab using the new ShowDashboardInSeparateTab menu command.

NOTE: These scenarios only work for applications with WebApplication > EnableMultipleBrowserTabsSupport set to True.


This short video below describes how you can enable all these options:

Blog Post: DevExpress Universal v17.2 released

$
0
0

I am pleased to announce that we have just released DevExpress Universal v17.2. This includes our suites for WinForms, ASP.NET, WPF, as well as DevExtreme. CodeRush Ultimate has also been updated.

For what’s new in this release, please go to this page and read all about the new features and enhancements.

This page shows the Resolved Issues introduced in this release. There are a great number, let me tell you, so apologies if it takes a little while to load the page…

For every major release, no matter how hard we try and minimize the impact, some new features and enhancements are bound to cause a few breaking changes. You can read about the v17.2 breaking changes here.

We are extremely grateful to everyone who provided feedback on our products, who used and tested the beta and provided information on the issues they found, and, of course, to all our customers who use our products every day. It’s simple: we would never be able to produce such robust and full-featured controls without this invaluable help. We are of the opinion that the new enhancements and features in v17.2 will validate your trust in our products.

(PS: worry not, VCL Subscription customers, the new release of that is coming…)

Blog Post: The Bezier Skin: Re-imagining WinForms Themes with Vector Graphics (Available in v17.2)

$
0
0

When you download v17.2 and run our WinForms demos, you'll notice a new skin style in the Ribbon gallery...one that's unlike any other skin we introduced before. As you've already discerned from title, it renders elements using vector graphics, and let me quickly outline what this means - starting with the most obvious benefit:

  • Resolution independence and sharp rendering on Hi-DPI displays.
  • New easy-to-use Skin Editor features: vector element library and straightforward color management.
  • Dozens of color schemes for the entire application.

Meet "The Bezier".

WinForms Vector Graphics Skin: The Bezier


Experience the Looks

The first thing I normally do to announce a new theme is show a screenshot. Not this time though. With "The Bezier", I can only show a default style, or a few styles out of many. You'll get glimpses of those styles in the videos below. But I urge you to run the demos and experience "The Bezier" for yourself, because this time it's not the looks that define the skin, it's the features I describe in the following sections.


Dozens of Color Schemes

When you browse the demos, switch the theme to "The Bezier" and then click Color Swatches next to the skin gallery. Here's a short video of what you'll see - the new slick Swatch Picker UI we've implemented in this release:

Unlike bitmaps in previously available skins, vector elements simply define shapes and can easily be colored into the exact colors you need. This lets you create custom color schemes by setting just about a dozen of colors. When working on this UI, our designer was going to come up with about five new styles to illustrate the idea, but ended up making 27. He then went on to make an even 30. Now they're all yours, and you can add even more.


Easily Alter Shapes Using a Pre-defined Element Library or Custom SVG Files

To try this next step, launch our updated Skin Editor application. We made it really easy to substitute skin element shapes by using a vast library of ready-to-use stencils shipping with the Skin Editor. Simply drag an element onto the the shape you want changed. Or, if you have your own SVG files handy, apply them instead.

The quick video below shows how to use the Skin Editor to accomplish the following tasks:

  • Changing a check box to enable rounded corners
  • Switching the check mark symbol to one of the pre-defined shapes
  • Importing custom SVG graphics to indicate checked states


Change Color of Individual Skin Elements

The same mechanism that enables color scheme functionality also allows you to manually specify colors for elements. Once again, this is very easily done using the updated Skin Editor. Here's another short video to demonstrate:


Download v17.2 Today

All this new functionality is shipping with v17.2, available today. Give it a try and should you have any questions, post to the comments section below.


Download The Besizer WinForms Skin with v17.2


Blog Post: Localization, Formatting and Mask Improvements for DevExtreme HTML5 Widgets (v17.2)

$
0
0

Localization is an important part of an application. I have recently covered a number of localization aspects in my blog post about localization for DevExtreme. Note that this post has been updated to reflect the news in v17.2.

Localization, Formatting and Mask Improvements

We received lots of feedback about practical scenarios and we have made significant improvements. It is now possible to specify custom formats without the need to include Globalize or Intl. Globalize is a powerful library that provides rich formatting and localization capabilities, but many applications require localization for one language only. Using Globalize is a non-trivial step, so we decided to directly support a number of scenarios where the power of Globalize isn’t really needed. Intl is much easier to use, but developers can still save time by taking advantage of our new built-in feature set.

In addition, we have added format support to the NumberBox and we have improved the behavior of masks in the TextBox.

Built-in support for custom formats

When working with numbers and dates, developers often need to define specific value formats. Prior to v17.2, DevExtreme supported only a few predefined formats out of the box. For custom formats, you had to use a 3-rd party i18n library (Globalize), or alternatively implement custom formatter and parser functions. Both approaches were more complicated than necessary for the use case.

In v17.2 you can now use custom formats in all widgets that support formatting. You can set a custom format with just simple format string, based on an LDML-like pattern. There is no need to define formatter or parser functions.

Date formatting examples

Displaying DataGrid column values with the full month name:

Grid with format

Using a custom format for the DateBox that displays the date, the time in 12-hour format, and milliseconds:

DateBox custom format

Number formatting

We have used feedback from v17.1 to analyze the most scenarios most important for our users, and implemented solutions for number formatting that will make the jobs of application developers easier. Meet the new NumberBox with custom formatting!

Formatting functionality in the NumberBox involves not only the formatting of the value itself, but also intuitive behavior of the input caret. Additional symbols can be added while the user inputs data (for example, the delimiters), and the caret keeps the correct position.

NumberBox Currency

It used to be a major inconvenience to make minor changes to a value format when using our editors, because 3rd-party libraries were required. Now we directly support the following use cases with a single “format” option:

Adding a prefix and/or postfix

With the support of format strings in NumberBox, you can easily display the unit for a number. For instance, use format: "#0 px" to denote pixels or format: "$#0" for a currency format.

NumberBox with prefix and postfix

For a currency format that observes localization, use format: "currency":

NumberBox with localized currency

Showing localized fractional and digit grouping delimiters

Different cultures have different number representation rules, different decimal delimiters, and digit grouping rules.

Using Intl or Globalize with the setting format: "#,##0.##”, the elements , (the thousands separator) and . (the decimal separator) are automatically replaced with the separators from your locale:

NumberBox number formatting

If you don’t use either Intl or Globalize, the built-in localization engine enables you to customize decimal and thousands separators manually, and the format strings use these settings.

Defining a precision in the NumberBox

The patterns not only specify number format, they also control input, preventing typing of incorrect characters and controlling the number of decimal places. Here are some examples:

"#0.##" - 2 decimal places, the fractional part is not mandatory

NumberBox Floating Point

"#0.000" - 3 decimal places, the fractional part is mandatory

NumberBox Fixed Point

Advanced scenarios

Of course the NumberBox still supports the 3rd-party localization libraries Globalize and Intl in addition to the built-in localization engine.

You can still define your own parser and formatter functions. Our documentation describes all the details, and please let us know via our Support Center if something is missing!

Intl localization improvements

Restrictions related to localization using the DevExtreme Intl integration are removed in v17.2:

  • It is not necessary to define a parser manually for any format (this was previously required for the DateBox and for date/time editing in the Data Grid). The correct parser is now generated automatically.

  • Custom format strings are available, as detailed above. Correct month names, decimal and thousands separators are automatically selected for the active locale. This type of custom formatting wasn’t previously supported when using Intl.

Intl localization functionality is now much closer to that of Globalize. Intl is easier to use, requiring only one external file instead of the many CLDR data files that Globalize requires.

TextBox mask improvements

During data entry, it is inconvenient to have to navigate the input caret using the cursor keys, especially when masks are being used. We have improved the default caret behavior:

  • If the current value is undefined and the TextBox isn’t focused, the caret will be set at the beginning of the input when you tap or click any part of the TextBox.

  • If the current value is defined and the TextBox isn’t focused, the caret is set at the end of the input when you tap or click any part of the TextBox.

  • If the TextBox is focused, the caret moves to the position where you tap or click it.

TextBox Mask improvements

A new mode has also been added to make the mask visible. The mask can always be displayed, or it can be shown only when the TextBox has been focused.

TextBox showMaskMode

Try it!

Version v17.2.3 is now available. Please visit the DevExtreme site for all the details.

Please let us know your feedback on the new features!


Blog Post: Web Dashboard Now Supports .NET Core (CTP)

$
0
0

The DevExpress Web Dashboard can now work on the latest .NET Core framework. While this is a pre-release (CTP), we're excited about this news and want to get your feedback.

.NET Core

The .NET Core 2.0 framework provides several benefits such as performance, flexible deployment, and cross-platform support. That means that you can run our Web Dashboard on Windows, macOS, and Linux.

For example, here is the Web Dashboard running on Linux (click image for larger version):

With .NET Core you can create ASP.NET Core Razor Pages, MVC Views and Controllers, Web API, use Docker, and more.

Getting started

To test our Dashboard in .NET Core locally, please download the latest v17.2 today from devexpress.com.

We've also prepared documentation to help you get started using the DevExpress Web Dashboard in ASP.NET Core:

Create an ASP.NET Core Designer application

Project Status

Once again, this is a CTP version. Report any issues, missing functionality, or suggestions as regular Support Center tickets. We'll be happy to review your feedback and optimize the API based on what we hear. This also serves as a reminder that the API is subject to change until we officially release.

In this CTP version, the Web Dashboard control does not support the following features:

  1. OLAP mode
  2. Export
  3. Localization

We'll continue to work on these features for the final release.

Help Us With Survey

Your feedback will help us decide the future direction. Please take a minute to fill out this short five question survey about your plans for ASP.NET Core usage:

.NET Core Survey - surveyjs.com

Are you excited by the DevExpress Web Dashboard now with the ability to run on .NET Core framework? Drop me a line below.

Thanks!

Email: mharry@devexpress.com

Twitter: @mehulharry

Blog Post: Scale (Axis) Breaks with DevExtreme HTML5 Chart and Range Selector (v17.2)

$
0
0

This post covers the DevExtreme Chart and Range Selector widgets, which are available for jQuery, as Angular components, ASP.NET MVC and ASP.NET Core MVC controls, and as Knockout bindings.

In v17.2, the dxChart and dxRangeSelector controls introduce a small but very useful feature: scale breaks a.k.a. axis breaks. This solves the problem where values in a chart have such a high amplitude that some series points are rendered very small, possibly almost invisible but certainly too small to interact with.

Chart without scale breaks

Scale breaks make such charts more useful by skipping parts of the scale. You can declare a collection of custom scale breaks, which is supported for both the value and the argument axis. The breakStyle property allows visual customization of the break appearance.

valueAxis: {
  ...
  breaks: [{
    startValue: 1,
    endValue: 14.6
  }, {
    startValue: 95,
    endValue: 318
  }, {
    startValue: 17.2,
    endValue: 95
  }],
  breakStyle: {
    line: 'waved' // default value
  }
}

The widget can also calculate the scale breaks automatically for the value axis:

valueAxis: {
  ...
  autoBreaksEnabled: true,
  maxAutoBreakCount: 3
}

Chart with scale breaks

Finally, custom scale breaks are implemented for the dxRangeSelector widget:

scale: {
  startValue: 15000,
  endValue: 150000,
  breaks: [{
    startValue: 20000,
    endValue: 35000
  }, {
    startValue: 100000,
    endValue: 145000
  }]
}

Range selector with scale breaks

Try it now!

You can get v17.2 right now via npm.

npm install devextreme@17.2

Please let us know your thoughts about this feature!

Blog Post: Adaptive Dialogs in DevExpress ASP.NET Controls (v17.2)

$
0
0

In the v17.2 release, we've updated many of our ASP.NET controls to use adaptive dialogs. I talked about this feature in this recent ASP.NET Spreadsheet post.

Adaptive Dialogs

An adaptive dialog will resize its content automatically according to the screen resolution. For example, here's the DevExpress ASP.NET RichEdit's File Open dialog that now supports adaptive behavior:

To achieve this, we used the FormLayout and Popup controls in adaptive mode. For v17.2, we added the adaptive layout feature to the Popup control. Check out the online demos of these controls here:

We use our smaller controls within our larger controls. So the DevExpress ASP.NET Scheduler, RichEdit, etc. now get the benefits of these smaller controls because we use them for functionality like dialogs.

Which Controls?

These four major controls now make use of adaptive dialogs now with v17.2:

  1. Spreadsheet
  2. Rich Edit
  3. HTML Editor
  4. Scheduler

You can experience these controls in our updated online ASP.NET demos.

ASP.NET MVC supported

The DevExpress ASP.NET MVC versions of these controls also support adaptive dialogs now.

Try it today

You can test these new features today by downloading the DXperience v17.2 Beta that is available in your download center (for existing customers).

Thanks!

Email: mharry@devexpress.com

Twitter: @mehulharry

Blog Post: DevExpress Dashboard: Performance Enhancements (v17.2)

$
0
0

Last week, I shared details of our upcoming WPF Dashboard Viewer (CTP). In this post, I’ll describe one of the performance enhancements we’ve incorporated into DevExpress Dashboard v17.2.

Performance is Priority #1

By utilizing a new way to prep data for analysis, we’ve improved data processing and calculation speed across numerous usage scenarios. DevExpress Dashboard now splits underlying data into separate parts which are processed in different CPU threads. As you might expect, this means that you can expect improved performance proportional to the number of cores in your CPU.

Faster is Better

Rather than waste time with hyperbole, we thought it best to illustrate how much faster DevExpress Dashboard v17.2 is when compared to its predecessor. We created the following test to determine data processing speed on a machine with the Intel Core i7 processor (4-cores): Microsoft's Contoso Dataset with the following SQL request (12M records returned)

select "FactOnlineSales".*, "DimProduct".*, "DimProductSubcategory".*,"DimProductCategory".*
  from ((("dbo"."FactOnlineSales" "FactOnlineSales"
  inner join "dbo"."DimProduct" "DimProduct"
       on ("DimProduct"."ProductKey" = "FactOnlineSales"."ProductKey"))
  inner join "dbo"."DimProductSubcategory" "DimProductSubcategory"
       on ("DimProductSubcategory"."ProductSubcategoryKey" = "DimProduct"."ProductSubcategoryKey"))
  inner join "dbo"."DimProductCategory" "DimProductCategory"
       on ("DimProductCategory"."ProductCategoryKey" = "DimProductSubcategory"."ProductCategoryKey"))

First Test Case

In our first test, we measured data calculation speed for the Grid Dashboard item using the following dimension and measure columns:

Dashboard v17.2 Performance Improvements Test One

  • Dimensions: ProductCategoryName, ProductSubcategoryName, DateKey (with the Quarter-Year group interval)
  • Measures: ProductName (Count summary type), TotalCost (Sum), SalesQuantity (Sum)

Data calculation performance for our first test case was as follows:

Dashboard v17.2 Performance Improvements Test One Results

Second Test Case

For the second test, the following dimension and measures were used:

Dashboard v17.2 Performance Improvements Test Two

  • Dimensions: ProductCategoryName, ProductSubcategory, BrandName
  • Measures: TotalCost, SalesQuantity (all with the Sum summary types).

Data calculation performance for our second test case was as follows:

Dashboard v17.2 Performance Improvements Test Two Results

Needless to say, DevExpress Dashboard v17.2 is significantly faster than its predecessor (3x faster for the first test case and 5x faster for the second).

Should you have any questions about the performance related enhancements to DevExpress Dashboard for .NET or want to share your thoughts with us, feel free to email us support@devexpress.com or submit a comment below.

Blog Post: Windows 7 support for DirectX in WinForms

$
0
0

Three weeks ago, at the start of our beta period for v17.2, I described a fascinating new feature for our data grid in WinForms: sidestepping GDI+ and going straight to DirectX for way faster rendering. At the time I mentioned that, unfortunately, it was limited to apps running under Windows 8 or later.

Well, no more. I am delighted to announce that this new direct-to-DirectX support is now available for grids in apps that run on Windows 7 as well. It’s there in the current version, no need to wait for the next minor.

Enjoy!

Viewing all 3388 articles
Browse latest View live