Quantcast
Channel: Developer Express Global
Viewing all 3388 articles
Browse latest View live

Blog Post: WinForms Accordion Control - Hamburger Menu and Navigation Pane support (v18.1)

$
0
0

The Hamburger Menu

The Hamburger Menu has a long history. It was introduced by Norm Cox in the early 1990s as a part of the user interface for the Xerox Star, but became much more popular in the last decade when mobile app developers were looking for ways to accommodate complex user interfaces on small mobile phone screens. The Hamburger Menu has become a universal UI element: three stacked horizontal bars are instantly recognized by end users today as “the main menu”. The metaphor is widely used in web and desktop applications, including modern UWP ones. For example, here’s a screenshot from a Microsoft Store “Mail” app:

Mail App

With our v18.1 release, the Hamburger Menu makes its way into the WinForms controls suite. Since our WinForms package already included lots of navigation and menu controls, we decided to extend existing feature sets rather than add a new control.

We integrated the Hamburger Menu in our Accordion Control: Set the ViewType property to HamburgerMenu and the Accordion Control supports a collapsed state where it mimics the behavior of Windows 10 apps and shows a narrow strip of icons.

Narrow Strip of Icons

Depending on the property OptionsHamburgerMenu.DisplayMode, the Hamburger Menu expands in three different modes. In Overlay mode, the expanded Accordion is drawn on top of the neighboring content.

Overlay Mode

Expanding the Hamburger Menu with the Inline mode applied forces the adjoining content to squeeze, making way for the Accordion.

Inline Mode

Finally, the option Minimal is similar to Overlay when the menu is expanded, but it reminds of mobile devices when the Accordion Control collapses, leaving the Hamburger Menu button as the only visible control part.

Minimal Mode

The Accordion Control has been a useful modern replacement for the original Navigation Bar ever since we first introduced it. It has several important advantages — in a nutshell, in case you have missed out so far:

  • Rich item header customization capabilities, enabling custom controls element-specific context buttons
  • DirectX rendering with support for visual effects like Acrylic (this will be available in v18.1)
  • An intuitive object hierarchy with AccordionElement objects as the only child elements used by the control
  • A modern appearance with visually minimalistic items

However, the early Accordion Control didn’t support the Navigation Pane View, a well-known navigation bar view inspired by Outlook and commonly used in modern applications.

In the upcoming v18.1 release, the Accordion Control now supports the Navigation Pane appearance, in the latest style shown in Microsoft UWP applications. To enable it, simply switch the EnablePaneFooter property to true.

Navigation Pane

As always, your feedback counts

Tell us what you think! Do you see these features making their way into your future projects? How do you feel about the Hamburger Menu in classic desktop apps?

Before I let you go, just a quick question - are you guys using 24/7 app monitoring services such as Logify? Our support team plans on using Logify with some of our enterprise customers and we’d love to know what you guys think of 24/7 app monitoring.


Blog Post: ASP.NET & MVC Spreadsheet - New Client-side API and Reading View (v18.1)

$
0
0

Customers of the DevExpress ASP.NET Spreadsheet control have given us some great feedback about their particular use case scenarios. We've taken this feedback and enhanced the DevExpress ASP.NET Spreadsheet control in the next major release, v18.1. It'll be available for both the DevExpress ASP.NET WebForms and ASP.NET MVC versions of the Spreadsheet control.

Client-side API

Many of the customer use cases that we investigated involved issues with editing the Spreadsheet's cells. To address these scenarios, we've added several client side methods and events to the ASPxClientSpreadsheet object:

  • CellBeginEdit Event - Occurs before the cell editor is opened.
  • CellEndEdit Event - Occurs before the cell editor is closed and the entered value is committed.
  • CellCancelEdit Event - Occurs before the active cell's editor is closed and the entered value is rolled back.

These three help you to manage when the cell begin, end, or cancel cell editing events are invoked. There are also event parameters that allow you to identify a cell element (column and row position), its value, entered formula (if any) and the name of the sheet on which the editing cell is located.

We've also added client side methods that allow you to process the data input programmatically:

  • ApplyCellEditing Method - Applies a value stored within the editor to the active cell.
  • CancelCellEditing Method - Cancels editing of the active cell.
  • SetCellEditorText Method - Specifies an editor's value of the edited cell.

These methods can be used for implementing scenarios like custom client side validation, update external controls, or implement a complex scenario such as a "Custom in-place editor".

Custom In-Place Editor

Previously, you were limited to only a couple of editors that we provided but with these enhancements to the DevExpress ASP.NET Spreadsheet, you can use any control for editing the cell value:

We've also added several client side methods that allow you to get the Spreadsheet's properties such as the current sheet name and rendered cell coordinates. For a full list of the client-side methods, properties, and events please take a look our documentation on the ASPxClientSpreadsheet's members.

Reading View Mode

Before v18.1, the Spreadsheet control had only one mode/view: Editing. By default, all the editing features were enabled for the document loaded into the control. Editing could be restricted using the document protection feature or the Spreadsheet ReadOnly property.

I'm happy to say that we're introducing a new mode for the Spreadsheet: Reading View.

When this mode is on, the document opened inside the control cannot be modified by the end user. The built in ribbon is transformed into a special toolbar that has a lightweight render compared to the “classic” ribbon. This mode is handy for mobile devices or in the scenarios when the Spreadsheet is used mainly for viewing data instead of editing.

The Reading View can be turned on using the built-in ribbon button or using the new client and server side API (SetViewMode Method). We've also added the ViewModeChanged event to give you even more control of the Spreadsheet when the view mode changes.

If you need more room for the Reading View then you can customize the toolbar or even hide it to provide more space for document content on small screens.

Are you looking forward to any of these ASP.NET Spreadsheet enhancements? Drop me a line below.

Thanks!


Email: mharry@devexpress.com

Twitter: @mehulharry

Blog Post: WinForms XtraCharts - Performance Improvements (v18.1)

$
0
0

For our Windows Forms ChartControl, performance is one of our highest development priorities. In the upcoming v18.1 release, we had the goal of improving rendering performance for High DPI resolutions. We also optimized the internal data processing algorithms to minimize the amount of memory allocated by the ChartControl.

DirectX Rendering

To render 2D charts, the existing ChartControl implementation used the GDI+ API exclusively. Given the performance of this API, large data visualizations on 4K displays were slow, especially in real-time applications.

We examined some possible solutions and decided to use hardware accelerated DirectX rendering, which is already supported by our Grid Control.

In our tests, the resulting rendering speed is up to nine times as fast as GDI+ mode in UHD resolution (up to four times as fast in Full HD).

Rendering Speed

Please note that while the rendering in DirectX mode is meant to be the same as in GDI+ mode, there are a few minor exceptions. For example, we’re having some issues with scale break rendering at this time, which we hope to resolve before release time. It is probably to be expected that a different rendering platform can generate slightly different results for complex visualizations, so we can’t guarantee pixel-perfect copies of the GDI+ renditions.

Optimized Data Processing

We have redesigned internal data structures used to store information in data-bound mode, in order to minimize memory consumption of the ChartControl. This chart illustrates the impressive results, with memory consumption down about 60%.

Memory Usage

Crosshair Cursor Optimization

We achieved a final remarkable improvement in our Crosshair Cursor implementation. In v18.1, the Crosshair Cursor is displayed immediately and without lag, even in real-time charting applications where a large numbers of Series items are displayed simultaneously.

The following animated image is quite large, my apologies in case it takes a few moments to load! I decided to include it anyway since it illustrates our improvements nicely. Note how, for the v17.2 chart, the horizontal scrolling of values stops completely when the mouse with the Crosshair Cursor is being moved. For v18.1, the same scrolling animation continues unchanged in the same scenario.

Crosshair Cursor Optimization

Blog Post: Rich Text Editor – Improved WYSIWYG Support (v18.1)

$
0
0

As we all know, accurate document rendering is an important feature for any word processing tool. In our forthcoming release, we’ve invested significant resources to improve the manner in which our DevExpress Rich Edit control for WinForms, WPF, and our Word Processing File API renders documents.

Before I describe what we expect to ship in v18.1, let me take a moment to detail the issues we sought to address in this release.

When we began work on our Rich Edit control over a decade ago, we decided to use a 96DPI display resolution to calculate its layout. Because high-resolution devices did not exist, our choice was a logical one. We used 300DPI for printing. Thus, the Rich Edit control calculated its display and print layouts using different units. This caused a problem with layout consistency in the Rich Edit control. A document would not accurately print content: paragraphs could slide apart, text lines could shift to the next page, etc. Here is an example:

Rich Text Editor - Print and Display Layouts in v17.2

To address this issue, your only option was to change display units. Unfortunately, this move could lead to layout corruption.

With the start of the high DPI era, we encountered new but similar issues. Pixel size is no longer absolute and is based on system settings. As a result, a document may not display properly on devices with non-standard DPI settings.

The bottom-line is simple: the need to modify our Rich Text Editors is no longer an option...we had to act.

With this release, we’ve modified layout calculation algorithms for both our RichEditControl (WinForms and WPF) and our Word Processing File API.

These modifications help to:

  1. Increase the accuracy of document layouts.
  2. Eliminate the need for any customization. Documents maintain the same appearance when displayed within the viewer, printed or exported to PDF.

And as you’ve probably guessed by now, DPI settings are also no longer an issue. Simply said, the changes we’ll introduce in v18.1 help ensure that “what you see is what you get.”

Rich Text Editor - Print and Display Layouts in v18.1

Unfortunately, there is a downside to these changes. Since we’ve updated the layout engine in v18.1, your documents may look different than in previous releases.

For those who want to retain previous document layouts, we’ve kept the previous behavior for backward compatibility. To activate it, enable RichEditControlCompatibility.EnableLegacyLayoutEngine option at the application start.

We are working hard to extend document layout accuracy and hope to incorporate additional enhancements in future release cycles. Please let us know what you think about this change. We’d love to hear your feedback.

Blog Post: CodeRush – New Release (v17.2.8)

$
0
0

Another 30 days. Another release. This update to CodeRush brings neat improvements to Smart Duplicate Selection, a port of Invert Selection, and the ability to quickly turn code into templates.

Coding Assistance

Smart Duplicate Selection/Line (Shift+Enter) gets the following improvements:

  • Single letter identifierparts are automatically incremented/decremented if CodeRush detects an alphabetically-ordered pattern in the code:


  • Enhanced support for duplicating parameters and arguments, letting you quickly declare new parameters based on existing parameters and the selection. To duplicate a parameter, select the part(s) you want to change (selected parts will become fields) and press Shift+Enter. Watch the videos below to see examples of what you can do.

    • Arguments


    • Parameters:


  • Expressions can now be duplicated. You can duplicate elements combined with a variety of different operators: string concatenation, bitwise, Boolean and arithmetic. Smart Duplicate Selection will insert a default operator and mark it with a TextField so you can change it later if needed. Watch the video below for examples of what you can do:


Refactorings and Code Providers

The Invert Selection code provider gets a port from CodeRush Classic. Use this code provider to invert selected lines of code in a variety of ways:

  • Assignments (a = b  →  b = a)
  • Boolean literals (true  →  false)
  • Addition/subtractionassignments (a += b  →  a -= b)
  • Equality operators (==  →  !=)

Templates

We have added the ability to create templates right from a code selection using a context menu. Simply select the code to become the basis for your template, right-click and choose Selection to Template...

Sel2Templ1

Sel2Templ2


CodeRush automatically creates Links and Fields based on the selected code and opens the new template in the Template Editor.

Give CodeRush a Try!

Download CodeRush from the Visual Studio Marketplace. And if you're enjoying CodeRush, please leave a review here so the whole world can see.

Blog Post: WinForms Map Control - Runtime Editor for Vector Items (v18.1)

$
0
0

Our Map Control can display several standard types of vector items: lines, ellipses, polygons, pushpins, callouts and others. We have had feedback from users of the control that indicated a need for more interactive capabilities, and so we decided to take our feature set to the next level in our upcoming v18.1 release by providing built-in support for vector item editing at runtime.

Runtime editing UI

We developed a special toolbar panel to provide quick access to most common editor functions:

Map Editor Toolbar Panel

The toolbar supports these operations:

  • Undo/Redo
  • Select/Transform/Edit
  • Add new elements (Pushpin, Path, Polyline, Dot, Ellipse, Rectangle, Line)

An end user can switch to Edit mode, draw new elements and edit or delete vertices. Here is an illustration showing some editing steps:

Editing Operations

Modified vector layer data can be persisted to a file using one of the supported formats (Shapefile, SVG and KML). This enables scenarios where end users load custom shapefiles in a mapping application and modify the shapefile data in place, without requiring a third-party tool.

Programmatic feature set

If you would like to provide your own toolbar or similar custom UI, you can take advantage of new MapControl API members to trigger the functionality from code:

private void OnDefaultModeChecked(object sender, ItemClickEventArgs e) {
  mapControl1.MapEditor.ResetEditMode();
}

private void OnTransformModeChecked(object sender, ItemClickEventArgs e) {
  mapControl1.MapEditor.SetTransformMode();
}

private void OnEditModeChecked(object sender, ItemClickEventArgs e) {
  mapControl1.MapEditor.SetEditMode();
}

private void OnCreatePathClicked(object sender, ItemClickEventArgs e) {
  mapControl1.MapEditor.SetCreateMode(CreatableMapItemKind.Path);
}

Allowing runtime editing

To activate the new feature in MapControl, use the MapControl.MapEditor.ShowEditorPanel property. Each layer can be excluded individually by setting the property VectorItemsLayer.AllowEditItems to false.

Finally, it is important to mention that the editing feature is compatible with Geographical and Cartesian coordinate systems, as well as the newly introduced Circular Scrolling functionality.

Blog Post: Reporting - Table and Cross-Tab Enhancements (v18.1)

$
0
0

Pivot Grid - Improved Cross-Tab Report Rendering

When you create a cross-tab report that contains a lot of data and spans multiple pages horizontally, the pivot grid displays row headers on the first document page only. This is inconvenient while viewing such a document since you need to navigate to the first page when you want to determine what row data the report shows:

Old cross-tab rendering

This issue is due to a limitation of our report generation engine. Customers have asked us to improve the situation for many years and we finished this feature implementation in v18.1:

Improved cross-tab rendering

We extended the PivotGridOptionsPrint class with the PrintRowAreaOnEveryPage property to allow you to manage this behavior for the PivotGridControl and the Reporting XRPivotGrid control. Do not forget to set theXtraReport.VerticalContentSplitting property to Smart to render the best possible document appearance.

XRTable — Improved Hidden Column Processing

A common case for reports representing invoices is that a Discount column must be shown conditionally (e.g. only if a client has discounts available, or depending on an application setting), and column sizes must be recalculated taking presence or absence of the column into account. In the past, we didn’t have a good solution for this scenario, so that results were often ugly:

Showing Discount columnDiscount column hidden

For v18.1, we extended the XRTable class with the new property ProcessHiddenCellMode, which defines how empty space is redistributed when table cells are hidden.

ProcessHiddenCellMode options

The ProcessHiddenCellMode property is in effect for cells that are hidden using one of the following approaches:

  • The Visible property of a cell is set to False at design time using the Visual Studio Properties window
  • An expression is specified for the Visible property of a cell
  • The Visible property of a cell is set to false at runtime (e.g. by handling the event XRControl.BeforePrint).
  • In an XRControl.BeforePrint event handler, the Cancel property on the event args is set to true.

The following modes are available for processing hidden cells:

  • StretchPreviousCell: The cell located to the left of the hidden cell is stretched to occupy the available space. If the hidden cell is the first in the row, the next cell to the right is stretched.

StretchPreviousCell

  • StretchNextCell: The cell located to the right of the hidden cell is stretched to occupy the available space. If the hidden cell is the last in the row, the previous cell to the left is stretched.

StretchNextCell

  • ResizeCellsEqually: All visible cells are resized to equally share the space that a hidden cell frees up.

ResizeCellsEqually

  • ResizeCellsProportionally: All visible cells are resized to proportionally share the space that a hidden cell frees up, based on their individual widths compared to the table width.

ResizeCellsProportionally

  • DecreaseTableWidth: The table width is decreased and visible cells are shifted close the gap left by the hidden cell. Cell sizes don’t change.

DecreaseTableWidth

  • LeaveEmptySpace (the default mode, corresponding to previous behavior): Empty space remains where the cell is hidden, other cells are not affected.

Blog Post: DevExtreme Charts - Client-side Data Aggregation (v18.1)

$
0
0

Data aggregation in charts in an important feature and in the v18.1 release, we've significantly improved it. Let me explain.

These days with big data, data aggregation is important to organizations in many areas such as statistics, data analytics, planning, business strategies, etc. Data aggregation's main goal is to visualize large amounts of data in a more readable form.

The DevExtreme Chart widget has been providing data aggregation for several releases. However, the feature wasn't very flexibile because you could not:

  • choose the aggregate function because only the median filter was available;
  • change the aggreagtion intervals or configure aggregation differently for each series. In fact, all you could do is turn the feature on/off for the entire chart.

Here's what it looked like prior to v18.1:

 $("#chart").dxChart({ 
    dataSource: dataSource, 
    useAggregation: true, 
    ...     
    series: [{}] 
});

Improved Data Aggregation

In v18.1, we completely reworked the data aggregation feature to address these issues and expand its capabilities.

Now you can:

Here's how easy it to set a custom aggregation method with DevExtreme charts in v18.1:

$("#chart").dxChart({
   dataSource: dataSource,
   ...
   series: {
      valueField: "carCount",
      aggregation: {
      enabled: true,
      method: "max"
      },
   ...
   }
}); 
  • specify different aggregation methods for different series:

$("#chart").dxChart({
    dataSource: dataSource,
    ...
    series: [{
        valueField: "dailyIndex",
        aggregation: {
            enabled: true,
            method: "avg"
        },
        ...
    }, {
        valueField: "monthlyIndex",
        ...
    }]
}); 

Use Synthetic Data Objects

Using a custom aggregate function, you can generate synthetic data objects for a series based on real data objects from the data source, as it is done in the following example for the range area series:

$("#chart").dxChart({
    dataSource: dataSource,
    ...
    series: [{
        type: "rangeArea",
        rangeValue1Field: "minTemp",
        rangeValue2Field: "maxTemp",
        aggregation: {
            enabled: true,
            method: "custom",
            calculate: function (aggregationInfo, series) {
                if (!aggregationInfo.data.length) {
                    return;
                }
                var temp = aggregationInfo.data.map(function (item) { return item.temp; }),
                    maxTemp = Math.max.apply(null, temp),
                    minTemp = Math.min.apply(null, temp);
                return {
                    date: aggregationInfo.intervalStart,
                    maxTemp: maxTemp,
                    minTemp: minTemp
                };
            }
        },
        ...
    },
    ...
    ]
});

Manage Interval Length

We also provided the capability to manage the length of aggregation intervals. You can specify the length in pixels using the aggregationGroupWidth option or in axis units using the aggregationInterval option.

$("#chart").dxChart({
    dataSource: dataSource,
    argumentAxis: {
        argumentType: "datetime",
        aggregationInterval: "month"
    },
    ...
    series: {
        valueField: "carCount",
        aggregation: {
            enabled: true,
            method: "avg"
        },
        ...
    }
});

Are you looking forward to the improved data aggregation capabilities of the DevExtreme Charts? Drop me a line below.

Thanks!


Email: mharry@devexpress.com

Twitter: @mehulharry


Blog Post: XtraCharts - Data Aggregation Improvements (v18.1)

$
0
0

The details in this post apply to the ChartControl in WPF and Windows Forms, the WebChartControl in ASP.NET WebForms, and the control created by the DevExpress.Chart() function when using ASP.NET MVC Extensions.

Additional flexibility for MeasureUnit

When visualizing DateTime values using a chart, it is possible to customize the detail level by setting the DateTimeScaleOptions.MeasureUnit property to a predefined unit (e.g. day, hour, minute, second, etc).

For our upcoming v18.1 release, we extended this functionality by introducing the property MeasureUnitMultiplier, which accepts an integer value. For instance, by setting the MeasureUnit to Minute and the MeasureUnitMultiplier to 15, you configure a measure unit of 15 minutes.

MeasureUnitMultiplier

It is important to mention that this feature is not currently compatible with work time and work day options. When a custom measure unit is specified, i.e. with a MeasureUnitMultiplier other than 1, these features are disabled.

Custom aggregation functions

In addition to custom measure units, we also improved the Data Aggregation mechanism by introducing a custom aggregation function API.

To enable this feature, set the AggregateFunction property for the axis scale to Custom and specify a callback that calculates aggregated values.

Custom Aggregate Function

Below is the sample custom aggregation function that transforms values into OHLC format for the image above.

XYDiagram diagram = chartControl.Diagram as XYDiagram;
diagram.AxisX.DateTimeScaleOptions.AggregateFunction = AggregateFunction.Custom;
diagram.AxisX.DateTimeScaleOptions.CustomAggregateFunction = new OhlcAggregateFunction();

class OhlcAggregateFunction : CustomAggregateFunction {
  public override double[] Calculate(GroupInfo groupInfo) {
    double open = groupInfo.Values1.First();
    double close = groupInfo.Values1.Last();
    double high = Double.MinValue;
    double low = Double.MaxValue;

    foreach (double value in groupInfo.Values1) {
      if (high < value) high = value;
      if (low > value) low = value;
    }

    return new double[] { high, low, open, close };
  }
}

Blog Post: DevExtreme - New React Wrappers vs Native React Components (v18.1)

$
0
0

This is exciting news: in our upcoming v18.1 release, we will have the full set of more than 65 new React components available, based on our existing DevExtreme widgets! This includes Charts, DataGrid, Scheduler, PivotGrid, and many others. The feature set, functionality and appearance of these React components is the same as that of the DevExtreme widgets.

The new React components “wrap” the core implementations of the existing DevExtreme widgets, adapting them to the React core API. That’s why we call this new library DevExtreme React Wrappers. You can follow the development progress in this GitHub repo.

DevExtreme Native React Components vs React Wrappers

Two Sets of Components for React

The availability of this new set of React components means that we now offer two different libraries for the platform. The library we released first currently has just one component (the React Data Grid), and we call it DevExtreme Reactive Components for React. Admittedly, the name is a bit complicated, but we need to distinguish from the same components that will be available for Vue in the near future! Charts and Scheduler are going to be released soon, and there is overall a lot of traction in this ongoing development.

The DevExtreme Reactive Components were written from the ground up targeting the React and Vue libraries with a shared core. On the other hand, DevExtreme React Wrappers reuse our DevExtreme widgets and make them available as React components.

Both approaches have their advantages. Please read on for more detailed explanations.

Comparing Our Two Offerings

To help you decide which of our libraries for React better suits your development needs, we categorized some of the differences:

Core UI Packages (Building Blocks)

DevExtreme Reactive Components are built on top of popular third party React UI libraries (react-bootstrap, reactstrap and material-ui). This means that our native components use the theming approaches supplied by these libraries, as well as included and third-party themes. Your application will benefit from the controls, the consistent APIs and the look&feel technologies that come with the libraries.

The DevExtreme React Wrappers don’t rely on third-party UI building blocks. They are built with their own markup and style-sheets. They support our own theming system, which supplies customizable themes including Bootstrap and Material Design. You can also import any Bootstrap LESS file to customize these controls with your favorite paid or free Bootstrap theme.

Level of Control

DevExtreme Reactive Components use the native React approach where all UI state is exposed via component properties. This gives you complete control over all aspects of state, and the components can be fully controlled or uncontrolled or anywhere in between. The rendering layers of the components are separate packages, and they can be replaced partially or completely. Reactive Components are configured by composing ‘plugins’, providing granular configuration choices for individual use cases in your application.

DevExtreme React Wrappers do not use this native React technique and therefore appear more like black boxes, components that perform some configuration work internally and invisibly. This can result in reduced manual control, but the automated mechanisms are smart, and you may well find it easier to configure root component properties rather than composing and configuring individual plugins. In the React sense, Wrappers can be used as uncontrolled and partially — not fully, since they expose only parts of their state! — controlled components.

You may prefer one approach over the other — we feel that both have their merits.

Feature Sets and Extensibility

DevExtreme Reactive Components are less than a year old and offer fewer components, less functionality and a smaller feature set than DevExtreme React Wrappers. The individual components are growing and so is the library as a whole. This set of components is young, but due to the modular plugin-based concept, extensibility is fantastic, with the best possible opportunities for you to add your own features or customize built-in ones.

DevExtreme React Wrappers are new for the upcoming v18.1 release, but since they are based on the DevExtreme widgets, they come with a much large feature set. However, some extensibility scenarios are not easy due to the comparatively monolithic component architecture — for instance, it’s not easy to replace the pager for the Data Grid with a custom one. Fortunately the Grid supports pager customization in itself, so you probably don’t need to replace the pager! This is meant as an illustrative example of a complicated customization scenario.

Here is a table with some comparison aspects.

AspectDevExtreme React WrappersDevExtreme Reactive Components
Components65+ React Components. Option to use feature/widget from the growing DevExtreme library.React Data Grid, Charts and Scheduler planned. Option to use native React components from react-bootstrap, reactstrap or material-ui.
PerformanceBuilt-in features provide rich high-performance functionality.Features modularized in plugins, immutable state, memoization, React optimizations, Virtual DOM and lightweight markup result in extreme performance.
Server-Side RenderingNot Available YetAvailable
Using ReduxAvailableAvailable
Ease of ConfigurationEasy, configuration via root component propertiesModerate, configuration via plugin composition

Code Examples

To leave you with an impression of the structure used for configuration purposes by the two component libraries, we have prepared the following examples. Both are shown using uncontrolled (stateful) modes.

DevExtreme Data Grid React Wrapper

<DataGrid
  dataSource={rows}
  paging={{ pageSize: 10 }}
  filterRow={{ visible: true }}
  columns={[
    { dataField: 'orderId', caption: 'Order ID' },
    { dataField: 'country', sortOrder: 'asc' },
    { dataField: 'region' },
    { dataField: 'date', dataType: 'date', filterValue: '2013/04/01' },
    { dataField: 'amount', format: 'currency' }
  ]}
/>

DevExtreme Native React Data Grid

<Grid
  rows={rows}
  columns={[
    { name: 'orderId', title: 'Order ID' },
    { name: 'country', title: 'Country' },
    { name: 'region', title: 'Region' },
    { name: 'date', title: 'Date' },
    { name: 'amount', title: 'Amount' },
  ]}><FilteringState
    defaultFilters={[{ columnName: 'date', value: '2013/04/01' }]} /><SortingState
    defaultSorting={[
    { columnName: 'country', direction: 'asc' } ]} /><PagingState
    defaultPageSize={10} /><IntegratedFiltering /><IntegratedSorting /><IntegratedPaging /><CurrencyTypeProvider for={['amount']} /><Table /><TableHeaderRow showSortingControls /><TableFilterRow /><PagingPanel /><Toolbar /></Grid>

What Do You Think?

We are excited about the launch of this full set of new React Components. We would love to see the great React apps you’ll build with our DevExtreme React Wrappers. In v18.1, they will be in a CTP stage. We are considering further improvements, such as server-side rendering support, Virtual DOM utilization for rendering, better state management capabilities, etc. Please try the components, and let us know which improvements you would like to see in the RTM release.

If you have any questions about the distinction between the two libraries for React, please describe your use cases and we will do our best to help you choose the appropriate DevExtreme Components for React.

Join the Webinar

Sign up for our upcoming “New in v18.1 - DevExtreme HTML / JS Controls” webinar where you’ll have a chance to see our React libraries demonstrated live and ask any questions about our React, Vue, or other client-side offerings.

Join the webinar: https://attendee.gotowebinar.com/register/9186007723238099714

Blog Post: Spreadsheet - Shapes and Usability Enhancements (v18.1)

$
0
0

Our upcoming release will include some major new features for our WPF and WinForms Spreadsheet controls and our Spreadsheet Document API. 

Shapes

For many, shapes play a key role in Excel document generation. Over the last few years, we received many requests from users to support shape rendering in our Spreadsheet components. 

The good news is that we've completed the initial implementation of this feature and it will ship as part of our v18.1 release cycle. You can now view, print and export (PDF) Excel documents that contain shapes. Our WinForms Spreadsheet control supports all shape types: from simple lines and rectangles to 3-D shapes with advanced effects. 

Our WPF Spreadsheet will also support shape rendering. Unfortunately, it will not support shape effects (such as bevel, shadow, 3-D rotation, glow, etc.) in the upcoming release. We will however implement this feature in our v18.2 release cycle.

Working with Shapes

Both our WinForms and WPF Spreadsheet controls will allow you to move, resize or remove shapes.

This release will not allow you to insert shapes into a document nor allow you to edit shape geometries. Our primary goal in both our v18.1 and v18.2 release cycles is to allow you to display, print and export shapes within documents that already contain shapes.

Formula AutoComplete

Creating formulas can be a complex and time-consuming task. To simplify the process as much as possible, we incorporated a Formula AutoComplete feature into our Spreadsheet controls. This feature assists you in creating and editing formulas by displaying a drop-down list of valid functions, defined names and table names that match the characters you enter into your formula.

Custom Colors for Individual Chart Series Points

As you probably know, our Spreadsheet Chart API allows you to apply custom colors to series points (v14.1+). With this release, you can display, print and export to PDF charts that contain series points with custom colors applied.

Automatic Document Format Identification

When you load a document from a file using the Open dialog or calling the LoadDocument method…

workbook.LoadDocument("Document.xlsx");

… we automatically identify the document format based on its content (regardless of the filename extension).

Printing Enhancements

In previous versions of our Spreadsheet Document API, printing support was limited in that you could not print a workbook without referencing the DevExpress XtraPrinting library (a library which is not part of the Office File API subscription).

In this release, we eliminated the need to use this library by implementing new Print methods in our Spreadsheet Document API. These methods allow you to print an entire document or individual sheets using default (or custom) printer settings.

using DevExpress.Spreadsheet;
using System.Drawing.Printing;
// ...

// Load a document into a workbook.
Workbook workbook = new Workbook();
workbook.LoadDocument("Document.xlsx");

// Create an object containing printer settings.
PrinterSettings printerSettings = new PrinterSettings();

// Define the printer to use.
printerSettings.PrinterName = "Microsoft Print to PDF";
printerSettings.PrintToFile = true;
printerSettings.PrintFileName = "Documents\\PrintedDocument.pdf";

// Specify that the first three pages should be printed.
printerSettings.PrintRange = PrintRange.SomePages;
printerSettings.FromPage = 1;
printerSettings.ToPage = 3;

// Print the document using the specified printer settings.
workbook.Print(printerSettings);

// Print the first worksheet using the default printer settings.
workbook.Worksheets[0].Print(); 

We also added the similar methods to our WinForms and WPF Spreadsheet controls.

Another great enhancement to our Spreadsheet Document API is that you can now print and export to PDF documents containing charts without the need to register chart rendering services manually. When you create a workbook instance, the WinForms version of these services is registered automatically. If you use the Spreadsheet Document API within a WPF application, you can replace these default services with WPF equivalents to ensure application consistency.

As always, we'd love to get your feedback on these new features - let us know what you think.

Before I let you go, just a quick question - are you guys using 24/7 app monitoring services such as Logify? Our support team plans on using Logify with some of our enterprise customers and we'd love to know what you guys think of 24/7 app monitoring?


Blog Post: React Data Grid - Tree Data and Banded Columns (v1.2)

$
0
0

Our upcoming release v1.2 of the React Grid contains two new big features: support for hierarchical data, and banded columns.

Hierarchical Data Support

Hierarchical data can be displayed in a tree structure. This feature is made available through three new plugins: TreeDataState, CustomTreeData and TableTreeColumn.

Tree Data

A guide for the Tree Data feature as well as an online sample are already available. You can see in the demo that other Grid functionality like Sorting, Filtering, Selection etc. can be used in conjunction with Tree Data.

Banded Columns

The second big new feature is Banded Columns, which are visual groups of columns. The TableBandHeader plugin is responsible for the implementation.

Banded Columns

A guide page is available for Banded Columns, which includes samples. This online demo also includes a Banded Columns configuration. Note that columns can still be resized and rearranged when they are included in a band!

Availability

At this time, a beta version of React Grid v1.2 is available. You can install it using the next tag:

npm i --save @devexpress/dx-react-core@next @devexpress/dx-react-grid@next
npm i --save @devexpress/dx-react-grid-material-ui@next

As usual, any feedback is greatly appreciated!

Blog Post: WinForms PDF Viewer and Document API - DirectX Rendering (v18.1, Beta)

$
0
0

The DevExpress WinForms PDF Viewer and PDF Document API will soon ship with DirectX rendering support.

If you’ve followed our blogs over the last few months, you already know the performance benefits DirectX rendering brings to the table (see our blog posts regarding our WinForms Grid for more information on DirectX). By moving from GDI/GDI+ to DirectX, we’ve radically improved the capabilities of our PDF Viewer and PDF Document API.

Text Quality

In previous versions of our PDF product line, text rendering quality was not as sharp as that available in products from Adobe (especially when scale was small because GDI uses integer coordinates for glyph positioning).

Thanks to DirectX, our upcoming release improves text rendering and text antialiasing. Frankly speaking, the improvement is remarkable: 

Graphics Quality

DirectX also allows us to support antialiased clipping. This feature was not available in previous versions because of GDI related limitations.

Text Rendering Modes

With our upcoming release, our PDF Viewer and PDF Document API will support all six text rendering modes. In addition to previously supported Fill, Fill then Stroke and Invisible modes, DirectX allows us to support Stroke and two Clip rendering modes. These latter modes are used to achieve advanced visual effects, as shown below.


Transparency and Blend Modes

GDI+ uses color values consisting of four components (Red, Green, Blue and Alpha) and provides alpha-blending calculations to mix colors. The PDF standard describes a complex transparency model, which not only supports this standard blend mode, but extends it to a wide set of advanced blend modes. Here are a few examples:

With the new DirectX engine, you will be able to use the power of this transparency model within your documents. 

How to enable it?

Note: Our new DirectX rendering engine is currently in beta. To use it, activate one of the following options:

  • WinForms PDF Viewer: enable the PdfViewer.RenderPageContentWithDirectX option;
  • PDF Document API: enable the PdfDocumentProcessor.RenderPageContentWithDirectX option.

Our DirectX rendering engine will be used by default when it officially ships in our v18.2 release cycle.

Compatibility and Limitations

DirectX support requires the Platform Update for Windows 7 or Windows 8.

Known Issues

The following are known issues – items you need to consider before using DirectX rendering: 

  • Document content is printed as an image.  This leads to a decrease in printing performance.
  • Very large images can be rendered slowly.

to say, we’re working to address these issues before the official release.

We’d love to get your feedback on this new capability. If you are an active Universal Subscriber, make certain to download our most recent beta today.

Blog Post: DevExpress ASP.NET - Adaptive FormLayout v18.1

$
0
0

With all the varying sizes of screens that your ASP.NET websites may run on these days, we've added a great new feature to help you display your forms on multiple devices.

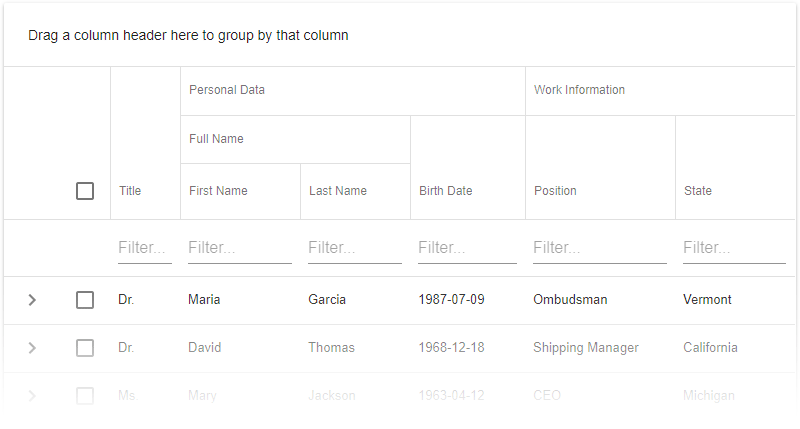
In the next major release, v18.1, the DevExpress ASP.NET and MVC FormLayout control ships with a new mode that allows you to create adaptive layouts with different column counts. So once you enable it, the FormLayout's elements will automatically reflow based on the editor size. This allows you to create, for example, a two-column layout for narrow screens and a three-column layout for wider screens:

Custom Layouts

You will be able to customize your grid layout depending on the FormLayout size. Attached is an example that demonstrates three layouts, but the number of possible variants is not limited. You can create different layouts for each of your devices, if necessary. Column and row spans are also fully supported.

Our R&D team worked hard to make this more powerful, fast and flexible. Let me describe how to create a layout required for your application, and show how this mode works.

1. Create General Layouts

Let's say that I want to create three different layouts that would allow me to display all form editors in different columns based on the screen width:

  1. 0px to 700px width - two columns
  2. 701px to 1100px width - three columns
  3. 1101px to 3000px width - four columns

First, encapsulate all the editors in one LayoutGroup and populate the LayoutGroup.GridSettings.Breakpoints collection with LayoutBreakpoint items:

[ASPx]<dx:ASPxFormLayout runat="server" id="MyFormLayout" width="100%"><Items><dx:LayoutGroup Width="100%" Caption="Registration form"><GridSettings StretchLastItem="false"><Breakpoints><dx:LayoutBreakpoint MaxWidth="700" ColumnCount="2" Name="XS" /><dx:LayoutBreakpoint MaxWidth="1100" ColumnCount="3" Name="M" /><dx:LayoutBreakpoint MaxWidth="3000" ColumnCount="4" Name="XL" /></Breakpoints></GridSettings>
...

The LayoutBreakpoint.ColumnCount property sets how many columns the LayoutGroup should display until the FormLayout reaches the LayoutBreakpoint.MaxWidth property value. The Name property is a unique Breakpoint identifier. It will be used later.

2. Customize Column/Row Spans

Now we can customize the column and row spans for every LayoutItem. For the 'First name' item, I want it to occupy two cells in a row when the LayoutGroup aligns items in two columns. Then, I want the item to occupy three cells in a row when the LayoutGroup aligns items in three columns. And finally, I want the item to occupy two cells in a row again when the LayoutGroup aligns items in four columns.

No row span is required: the item is placed only within its own row. Here's the resulting SpanRules:

[ASPx]<dx:LayoutItem Caption="First name" VerticalAlign="Middle"><SpanRules><dx:SpanRule ColumnSpan="2" RowSpan="1" BreakpointName="XL"></dx:SpanRule><dx:SpanRule ColumnSpan="3" RowSpan="1" BreakpointName="M"></dx:SpanRule><dx:SpanRule ColumnSpan="2" RowSpan="1" BreakpointName="XS"></dx:SpanRule></SpanRules>
 ...

Note that I used the SpanRule.BreakpointName property to bind each SpanRule to a corresponding group layout (use the values that are set in LayoutBreakpoint.Name properties). For brevity, I skipped several items, because they are customized in a similar way. However, you can find the details in the attached project below.

The next one is an item with a RatingControl. I want the item to occupy one cell in a row, but two cells in a column when the LayoutGroup has three or four columns. Then I want the item to occupy one cell in a row and one cell in a column when the LayoutGroup has two columns. Here's the resulting SpanRules:

[ASPx]<dx:LayoutItem Caption=" " VerticalAlign="Middle"><SpanRules><dx:SpanRule ColumnSpan="1" RowSpan="2" BreakpointName="XL"></dx:SpanRule><dx:SpanRule ColumnSpan="1" RowSpan="2" BreakpointName="M"></dx:SpanRule><dx:SpanRule ColumnSpan="1" RowSpan="1" BreakpointName="XS"></dx:SpanRule></SpanRules>
...

Finally, an item with a Button. I want the Button to occupy one cell when the FormLayout is wide:

[ASPx]<dx:SpanRule ColumnSpan="1" RowSpan="1" BreakpointName="XL"></dx:SpanRule><dx:SpanRule ColumnSpan="1" RowSpan="1" BreakpointName="M"></dx:SpanRule>

However, when the FormLayout becomes narrow, the Button should occupy the entire row. Since the LayoutGroup has only two columns when the FormLayout width is less than 700px:

[ASPx]<dx:LayoutBreakpoint MaxWidth="700" ColumnCount="2" Name="XS" />

I add the following SpanRule to the LayoutItem settings:

[ASPx]<dx:SpanRule ColumnSpan="2" RowSpan="1" BreakpointName="XS"></dx:SpanRule>

The default value of ColumnSpan and RowSpan properties is 1. I explicitly added them to markup to illustrate this.

Now take a look at the GridSettings.StretchLastItem setting. If GridSettings.StretchLastItem is enabled and there is some free space after the last item in a row, the last item will be stretched to the row's end.

IMPORTANT NOTE: If you add custom content inside a LayoutItem then please make sure that it is responsive. Unresponsive content prevents an item from collapsing and the adaptive grid layout may appear to be broken.

3. Wrap Captions

You can also have the caption location wrap around the control when there is not enough space to display it next to the control. You can see this behavior in the top gif animation above. Initially, the captions are located to the left of the control when there is enough space. However, once we resize and reach our breakpoints, the caption move above the control.

The GridSettings.WrapCaptionAtWidth property allows you control this behavior.

4. Default Breakpoint

One last piece of info you should be aware of is the default breakpoint. For example, let's say we have the following breakpoints setup:

[ASPx]<Breakpoints><dx:LayoutBreakpoint MaxWidth="500" ColumnCount="1" Name="S" /><dx:LayoutBreakpoint MaxWidth="800" ColumnCount="2" Name="M" /></Breakpoints>

We have an S breakpoint for the 0px - 500px FormLayout width and the M breakpoint for the 501px - 800px width. But if your FormLayout has the width is larger than 800px, the default breakpoint will work. It's possible to set the ColumnCount property for this breakpoint at the LayoutGroup level (or at the FormLayout level):

[ASPx]<dx:LayoutGroup Width="100%" Caption="Registration Form" ColumnCount="3">

And specify the ColumnSpan/RowSpan properties at the LayoutItem level:

[ASPx]<dx:LayoutItem Caption="City" VerticalAlign="Middle" ColumnSpan="2">

Download Sample

Download and run the attached sample project to evaluate this new responsive mode on your local development machine.

Over the last few years, we've steadily provided many responsive and adaptive features to keep our ASP.NET controls modern and up with latest trends. In fact, in the last release (v17.2), we added adaptive support to our Popup control.

We'd love to hear your feedback about the FormLayout control's new Adaptive features and API. Please leave a comment below or contacting our support team if you've got some longer feedback.

Thanks!


Email: mharry@devexpress.com

Twitter: @mehulharry

Blog Post: WPF Accordion - Navigation Pane Style (v18.1)

$
0
0

Our Accordion Control was released as a modern alternative to the trusty Navigation Bar. The control is still subject to constant improvement, and for our upcoming v18.1 release, we introduced support for the Navigation Pane view style that was previously supported by the Navigation Bar. The style is achieved by taking advantage of integration with the Office Navigation Bar.

Here is what the Accordion control looks like by default:

Accordion Default Appearance

The Accordion leaves the display of its root items to the Office Navigation Bar, when the new integration is activated:

Integration with Office Navigation Bar

The Office Navigation Bar supports a Compact mode, like Microsoft Outlook:

Activate Compact Mode

With this mode active, the root items of the Accordion are shown as buttons at the bottom of the Accordion layout.

Button Display in Compact Mode

Activating the integration is very simple: just specify the property OfficeNavigationBar.NavigationClient:

<dxnav:OfficeNavigationBar NavigationClient="{Binding ElementName=accordion}"/><dxa:AccordionControl x:Name="accordion" CompactNavigation="True"><!-- ... --></dxa:AccordionControl>

Finally, the Peek Form feature of the Office Navigation Bar lends itself well to the new Navigation Pane style. When the user hovers the mouse over a root item, the Peek Form pops up:

Peek Form

Note that a Peek Form template needs to be specified using the property AccordionItem.PeekFormTemplate. This allows you to easily implement your own Peek Form functionality.


Blog Post: WinForms/WPF Reporting - Ribbon Report Designer and Other UX Improvements (v18.1)

$
0
0

Our End-User Report Designer components were originally derived from the implementation we created for developers. We tried to make every feature of the reporting system available in the designers, and to keep the UI usable at the same time. The components are very popular, so we must have succeeded to some extent! However, our concerns about UI complexity grew with the feature set and eventually we decided to implement several changes and enhancements to make users’ lives easier. Below you find an overview of the changes coming up in v18.1.

New Microsoft Office-inspired Ribbon structure

The use of a Ribbon in our report designer component is not new. However, a detailed analysis of Office applications showed that, in comparison, our Ribbon structure was less than optimal in the past. Being consistent with the way things work in Office also makes sense since it allows users to transfer knowledge of usage patterns more easily.

For our new Ribbon structure, we introduced core Ribbon tabs called Home, Layout, Page and View for general commands, as well as contextual tabs that offer commands relating to currently selected report controls. Here’s how the Ribbon looks now:


The new structure improves discoverability of report element features, which simplifies the report designing process especially for end users. The Preview and Scripts tabs are now clearly separated on the right side, and the new Designer tab helps switch back to the designer surface after previewing a document or implementing a script. Finally, the images shows that we have removed the Toolbox tab as well and now the report controls are available in a sidebar. You don’t need to switch to a specific Ribbon tab any longer to add a new control to a report!

This new appearance of the Ribbon End-User Report Designer is enabled by default, but you can hold the Alt key while dropping the component onto a form if you still prefer the old one:

Report Designer Toolbox Tooltip

If you display the designer from code, this line switches back to the old style: DevExpress.XtraReports.Configuration.DesignSettings.Default.UseOfficeInspiredRibbonStyle = false;

For the WPF platform, you need to set ReportDesigner.UseOfficeInspiredRibbonStyle = false instead, from code or XAML.

Finally, note that we do not perform automatic conversion of the old Ribbon toolbar when a project is updated to v18.1. If you have implemented a custom End-User Report Designer, you need to remove the XRDesignMdiController component (by default it’s called reportDesigner1) from your form and drop the RibbonReportDesigner from the toolbox once again.

In addition to the general Ribbon structure improvements, we also decided to adopt the approach of the Microsoft Word Style Gallery for report controls. The new item allows users to preview defined styles, and to assign them to multiple selected controls at once:


The Styles node is still available in the Report Explorer panel, but we will consider removing it in the future because it isn’t really needed anymore in addition to the Style Gallery. Please let us hear any thoughts you have on this topic!

Properties Panel – Favorite Properties View

Unfortunately, the Properties panel can be filled with large numbers of properties for some of our complex report controls. This can make it hard to find a specific property, even if it is one that’s frequently used. This is the scenario we’re trying to improve with the new Favorite Properties view.

Click the Edit Favorite Properties menu item to display a collection editor dialog listing report controls from the active report, and select the properties you’d like to see included in the favorite list. By default, properties available in a control’s Smart Tag menu are included:


Now you can use the Show Favorite Properties menu item to bring up a filtered view of properties on the selected control:


WinForms Report Designer Dock Panels – Light View

This feature doesn’t make the designer easier to use directly, but it updates the dock panels of the End-User Report Designer a more current appearance. The new Light mode of the Dock Manager shows clean 1-pixel borders for dock panels across all skins of the Windows Forms product line. Here is a screenshot with the Bezier skin enabled:


The XRDesignMdiController.DesignSettings.DockingViewStyle and PrintControl.DockingViewStyle properties manage this view mode at the level of both Document Viewer and End-User Report Designer, so you can provide a consistent appearance for your reporting application, whether you supply a custom-built designer or display the built-in Print Preview.

WPF Report Designer – Office-inspired Property Grid UI

The last user interface improvement we want to mention relates to the Properties Panel of the WPF Report Designer. It now mimics the layout of similar panels found in Office products, and provides advanced value editing for report control properties:

WPF Property Grid

This feature targets WPF only in v18.1, but we are hoping for feedback and we will consider introducing a similar appearance for our WinForms Report Designer in the future.

Your feedback is important

Please let us know if you have any ideas for further improvements to the user experience of the Report Designer components, and share with us any concerns you or your end users have!

Blog Post: WinForms & WPF Rich Text Edit – Checkboxes (v18.1)

$
0
0

Good News! Our WinForms and WPF Rich Text Editors will soon support checkbox form fields. If you’re an active Universal or DXperience subscriber, please make certain to download beta 1 of our next major update (v18.1) to learn more about our implementation and how you can integrate this feature in your next WinForms or WPF project.

Checkbox form fields allow you and your users to create/view documents with checkbox fields and to print or export the document to PDF/HTML files. Suffice it to say that checkbox fields are interactive – users can select/deselect individual checkboxes as needed.

In today’s most popular word processing tools (such as Microsoft Word), checkbox related user interface elements are hidden by default.  We followed this same practice and did not add any UI elements to insert checkboxes directly into a document. Instead, we created an API to generate and customize checkbox properties as needed. You can call the FormFieldCollection.InsertCheckBox method to create checkbox at a specific position within a document and then define its state and size. 

As always, we welcome your feedback. Please tell us if and how you might use this new feature in your next WinForms or WPF project. We’d also love to hear from those of you who’re using our Rich Text Editor – how are you using it? Are you using our RTF Control as an alternative to Word? Are you using it for mail merge? 

Blog Post: DevExtreme DataGrid and TreeList - Integrated Filter Builder (v18.1)

$
0
0

In the last release, v17.2, we introduced the powerful Filter Builder widget for DevExtreme. It provides the UI for building of complex filter expressions, which are useful for controls like the DataGrid and TreeList.

Starting with v18.1 release, we've now integrated the FilterBuilder directly into the DataGrid and TreeList. You can enable it using a single option:

{
   // …
   filterPanel: { 
      visible: true,
   }
}

Once the filterPanel option is enabled, the widget will display the Filter Panel that shows the current filtering criteria at the bottom of the data table. Click the filtering criteria text to display the Filter Builder.

Filters Synchronization

Recently, customers asked us about synchronization between the filter builder and the filter row and header filter (Filter builder integration with Filtering of dxDataGrid and DataGrid - How to pass the Header Filter value to FilterBuilder). And we are happy to introduce this feature in v18.1 too. This new feature enables users to see the aggregate filtering condition in one place. It is helpful when working with complex filtering criteria:

You can use the following options to customize and control the new features:

{
// …
    filterValue: [], // set/get current filter criteria of the Filter Builder 
    filterSyncEnabled: 'auto' // enable/disable filtering UI elements synchronization
    filterPanel: { 
        visible: true, // show/hide filter panel 
        filterEnabled: true, // enable/disable filtering
    },
    filterBuilderPopup: {}, // customize the Popup
    filterBuilder {} // customize the Filter Builder
}

If you have questions or suggestions, then please take part in the discussion about this feature on GitHub.

Angular, Vue, React, ASP.NET MVC / Core and more

All of these new features will be available on all the frameworks we support: Angular, Vue, React, jQuery, Knockout, ASP.NET MVC and .NET Core.

Test It Today

If you want to give these features a test-drive then simply add it to your project by entering:

npm install --save devextreme@18.1-unstable

If you're not using npm, check out my earlier blog post about pre-releases.

Join the Webinar

Sign up for our upcoming “New in v18.1 - DevExtreme HTML / JS Controls” webinar where you’ll have a chance to all the new DevExtreme v18.1 items demonstrated live and ask any questions about our ASP.NET MVC, ASP.NET Core, React, Vue, or other client-side offerings.

Join the webinar: https://attendee.gotowebinar.com/register/9186007723238099714

Like it?

We'd love to hear your feedback about the new integrated Filter Builder for DevExtreme DataGrid and Treelist controls. Drop me a line below, thanks.


Email: mharry@devexpress.com

Twitter: @mehulharry

Blog Post: CodeRush – Cheat Sheet (v3)

Blog Post: .NET Charts - New Crosshair Features (v18.1)

$
0
0

In addition to Crosshair Cursor performance improvements mentioned in our recent post about performance improvements, we extended the Crosshair functionality on the basis of some very popular customer requests. The improvements apply to Chart Controls for WinForms and WPF, as well as ASP.NET WebForms and MVC, in our upcoming release v18.1.

New Crosshair Line mode: Free

We introduced a new Crosshair Cursor mode where snapping is disabled and lines are shown directly at the current mouse pointer position:

Free Lines

To enable this feature, set the property ChartControl.CrosshairOptions.LineMode to Free.

Note that the property CrosshairOptions.SnapMode (link for WinForms and ASP.NET, link for WPF) is still used in this mode to determine which values are selected for inclusion in the crosshair output.

Crosshair Details in the legend

In certain situations it can be convenient to display Crosshair Cursor information in the Legend panel instead of the standard “tooltip” popup window. This image shows a legend filled with Crosshair detail for the year 2016:

Crosshair Information in the Legend

Use the property ChartControl.CrosshairOptions.ContentShowMode to move the Crosshair Cursor data to the legend. Note that it is also possible to customize this option for an individual series using the Series.CrosshairContentShowMode property.

Include extra field values in Crosshair information

The final new feature is perhaps the best of the lot: you can now display arbitrary extra data source field values in the Crosshair output using the pattern syntax (link for WinForms and ASP.NET, link for WPF).

For example, the following text pattern includes the value of a field called Discount in the Crosshair output: {S}: {V:F2} (Discount: {Discount:P0}). The newly extended pattern syntax interprets the part {Discount:P0} as an instruction to include an extra field value.

Extra Field Values

Viewing all 3388 articles
Browse latest View live